

Is its future truly bleak, as recent reports suggest?
If you’ve kept an eye on the news lately, you’ll have witnessed the prevailing narrative of "doom and gloom" in the construction industry, often fuelled by analysis of the corporate regulator’s insolvency statistics. However, a closer examination of the Australian Securities and Investments Commission’s (ASIC) data reveals a more nuanced picture. Let's delve into the numbers and explore whether there’s alternative explanations or contributing factors at play.
Since the financial year ending (FYE) 2014, ASIC has collected data on insolvency appointments, categorising them by industry type. Within this dataset, the construction industry has consistently stood out due to its notably high insolvency numbers. In FYE 2014, 1,802 insolvencies were recorded in the construction sector. Fast forwarding to FYE 2022 and FYE 2023 (until the end of April 2023) the numbers stood at 1,284 and 1,750 respectively; lower than what we saw in 2014. These numbers would appear to indicate that the construction industry continues to face challenges, albeit with a relatively steady pace of insolvency appointments.
A cursory glance at the graphed history below helps paints the picture.

What stands out in the graph is the “relatively” steady trend in total appointment numbers within the construction industry over time. Yes, recent quarters show increased activity, however, it’s essential to consider that this follows reduced insolvency activity during the COVID-19 pandemic. Therefore, the recent uptick should perhaps be viewed in the context of the normalisation of construction insolvencies following the pandemic-induced slowdown.
Other relevant considerations include:
Construction as a category has always been the largest sector in the insolvency appointment statistics. Not only is it a broad encompassing category, also consider that one construction business insolvency may result in multiple entities being placed into external administration due to the use of group structures, SPV’s[1], and the industries use of incorporated sub-contractors. Each company/entity is counted as a separate insolvency appointment, which may lead to an arguable skewing of the numbers when considering the number of “businesses” that have failed.
The data does not differentiate the size of a company’s business. A large construction company counts the same as a small incorporated sub-contractor. Therefore, the overall figures may not accurately reflect the financial health of individual businesses or provide a complete picture of the industry's performance.
It is also crucial to examine the long-term trends within any dataset to gain a comprehensive understanding of the situation. Notably, the representation of the construction sector as a percentage of the total insolvency activity has indeed been increasing over time. In FYE 2014, construction insolvencies accounted for 18.35% of the total activity. As indicated in the table below, the construction sector is now rapidly approaching the 30% of total insolvency mark—and is well above its long-term average.
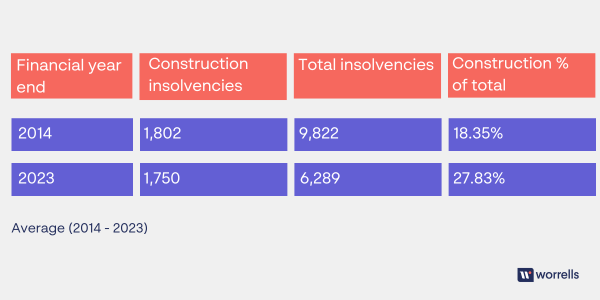 FYE 2023 figures are for July 2022 to end of April 2023.
Looking at the percentage compared to the actual appointment number raises an interesting proposition: is the construction sector truly overrepresented, as often reported, or are other sectors currently underrepresented and yet to experience comparable increases in insolvency activity?
I suggest the possibility and reality is construction is merely leading the charge when it comes to normalising insolvency activity—in which case the current media hype could be exaggerated. As a final thought, if the insolvency numbers are making headlines now, imagine what they could become in the months ahead, given the economic challenges of labour shortages, inflationary pressures, wage pressure, high interest rates, and supply chain constraints. It's arguable that the true doom and gloom is yet to descend upon us.
Special thanks to Daniel Alcock, manager in Worrells Melbourne who assisted with the statistical research and analysis.
Sources: Australian Securities and investments Commission – insolvency Statistics (current) – Series 1A: Companies entering external administration and controller appointments by industry, July 2013–July 2022. Released: September 2022.
[1] A special purpose vehicle (SPV) is a regular limited company used solely for a particular purpose.

.jpeg?auto=format,compress&cs=tinysrgb&fit=crop&crop=focalpoint&fp-x=0.50&fp-y=0.50&fp-y=0.1&w=800&h=480&q=25&blur=5&sat=-100)

.jpg?auto=format,compress&cs=tinysrgb&fit=crop&crop=focalpoint&fp-x=0.50&fp-y=0.50&fp-y=0.1&w=800&h=480&q=25&blur=5&sat=-100)