
Debt Agreements and Personal Insolvency Agreements have reached their highest levels ever!
In mid-February, the Australian Financial Security Authority (AFSA) released the personal insolvency statistics for the final quarter of 2017—giving us the chance to examine the numbers on both a quarterly and annual basis.
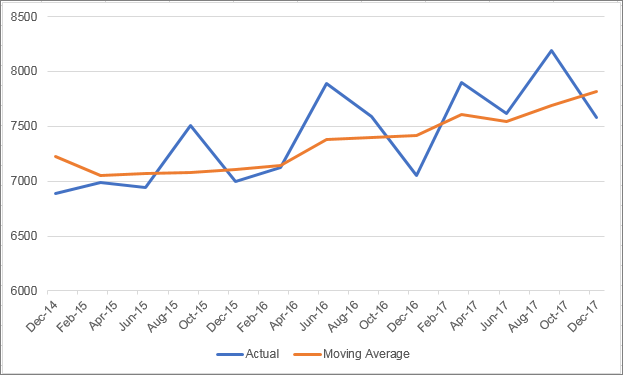
Nationally personal insolvency activity declined in December 2017 from September 2017, however a general reduction in personal insolvency in the last quarter of the year has been a regular trend for the last several years. Year-on-year personal insolvencies continued their growth trend, with another 7.4% increase in December 2017.
Graph: Quarterly personal insolvency activity in Australia
A quick review of the comparative statistics against the December 2016 quarter shows that in the December 2017 quarter:
- Bankruptcies rose 1.3%
- Debt agreements rose 15.3%
- Personal insolvency agreements rose by 14%
- Total personal insolvencies rose by 7.4%
Debt agreements continue their growth. While bankruptcies remained the most popular form of personal insolvency through 2017, the gap continues to close. Debt agreements have now recorded two and a half years of growth.
In examining the stats for the entire year of 2017, the conclusion is that it has been a growth year for personal insolvency with an overall increase in total appointments of 2.1%—a smaller increase than we saw in the 2016 which was the largest increase since 2009 when the Global Financial Crisis spurred personal insolvencies to record levels.
Three states with the highest percentage change in their insolvency activity from last year are the Northern Territory (NT), South Australia (SA) and Western Australia (WA), each showing growth in personal insolvencies for more than 14%. It is likely that the well documented downturn in the mining industry is responsible for the increase in WA and NT, while a reduction in manufacturing in SA may be the cause of the increase there.
The only states to show a decrease in total personal insolvency activity were New South Wales and Victoria. Both states saw strong economic growth in 2017 (2.9% and 3.3% respectively) which is generally associated with reductions in personal insolvencies.
The popularity of alternatives to bankruptcy is a trend that has remained prominent through out 2017 and looks set to continue into 2018. Once again total bankruptcies fell while both debt agreements and personal insolvency agreements rose. In 2017, both debt agreements and personal insolvency agreements reached their highest levels ever recorded.
The increase in total personal insolvency activity can be attributed to the prevalence and popularity of alternatives to bankruptcy.
Looking ahead
Looking ahead, the prospects for the Australian economy appear good, with the RBA predicting the slow economic recovery to continue through 2018. This should have a steady downward pressure on personal insolvency appointments in 2018. However, the Australia economy remains vulnerable with a number of challenges that may limit growth in 2018, including a tightening labour market, a cooling housing market and record household debt levels.

.jpeg?auto=format,compress&cs=tinysrgb&fit=crop&crop=focalpoint&fp-x=0.50&fp-y=0.50&fp-y=0.1&w=800&h=480&q=25&blur=5&sat=-100)

.jpg?auto=format,compress&cs=tinysrgb&fit=crop&crop=focalpoint&fp-x=0.50&fp-y=0.50&fp-y=0.1&w=800&h=480&q=25&blur=5&sat=-100)