Annual personal insolvency stats released
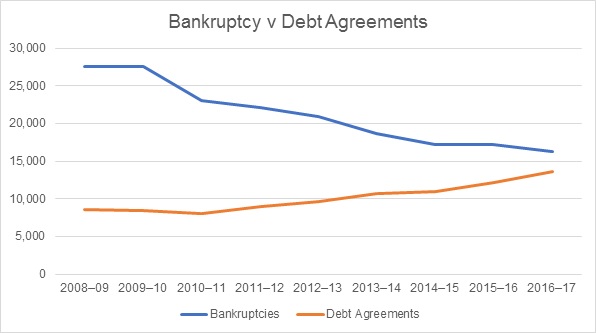
Last month, the Australian Financial Security Authority (AFSA) released the personal insolvency statistics for the June quarter and the annual personal insolvency statistics for 2016-17. We’ve taken these data sets to conduct both quarterly and year-on-year analyses. The rise of personal insolvencies has been the theme of our articles for the last year, so it came as no surprise that 2016-17 showed an overall increase of 2.1% in personal insolvency activity over 2016-17, even though the appointments in the June quarter 2017 fell. Compared to the same quarter last year (June 2016), total personal insolvencies in the June quarter 2017 fell 3.5%, with a decrease of 13.8% in bankruptcies outweighing an increase of 10.2% in debt agreements and 11.5% increase in personal insolvency agreements. The June 2017 quarter was the lowest quarterly level of bankruptcies since June 2014, and was another record quarter for debt agreements. Debt agreements are now almost as common as bankruptcies in most states. We believe that this is because of two reasons—debt agreements do not have the same stigma attached as bankruptcy, and heavy advertising by professional firms that specialise in this area. The growth trend can clearly be seen in the below graph, and we expect debt agreements to overtake bankruptcies as the most prevalent form of personal insolvency. Through the year, we regularly discussed the separation between personal insolvency growth rates and the states with mining dominated economies and the eastern states, whose economies rely less on mining.
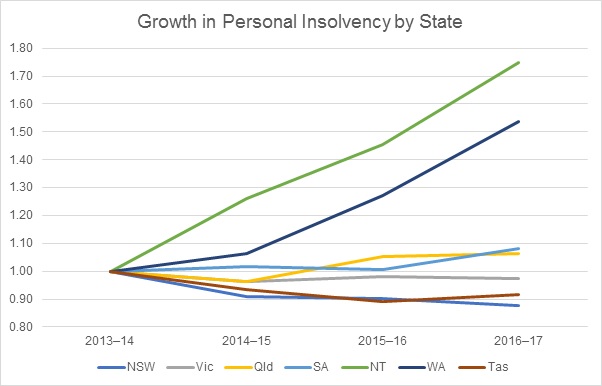
  The above graph, mapping growth in annual personal insolvency statistics per state since the mining boom’s end in 2013-14, clearly shows this divide; with WA, NT, Qld and SA, clearly outpacing NSW, Vic and Tas. Looking toward the 2017-18 financial year, we expect to see growth in personal insolvency continue, with debt agreements providing the majority of that growth.
.jpeg?auto=format,compress&cs=tinysrgb&fit=crop&crop=focalpoint&fp-x=0.50&fp-y=0.50&fp-y=0.1&w=400&h=400&q=25&blur=5&sat=-100)

.jpg?auto=format,compress&cs=tinysrgb&fit=crop&crop=focalpoint&fp-x=0.50&fp-y=0.50&fp-y=0.1&w=800&h=480&q=25&blur=5&sat=-100)
