
With information, insight can follow.
Last month we released The Worrells Insolvency Report: 2015/16 which is largely founded on the current data that ASIC and AFSA publish. As insolvency practitioners, we are often greeted with a foreboding sense of being the undertakers of the financial world. This perception is one that we try to reframe for advisors as Worrells being the most qualified and experienced at being able to detect and predict when their clients (as individuals or relating to a business—sole trader, director, and trust entities) need to restructure to avoid a formal state of insolvency, or in the face of certain insolvency: to minimise its impact.
So why do we create ‘The Worrells Insolvency Report’?
Our aim is to build a snapshot of the Australian insolvency market, its emerging trends, the drivers that actively influence the marketplace and the effects on the people within it. We hope it helps advisors and the community at large to dispel the stigma around insolvency.
But we also find that it helps us in our cause. For example, it enables us to identify specific industries facing challenges, it allows us to understand the ATO’s debt collection procedures and policies being used—as they fluctuate, and even identify a trend in the causes for individuals’ financial struggles.
This article offers a few observations that can be extracted from our Report.
Personal Insolvency
Nationally, 89 percent of bankrupts initiated their own bankruptcy—as opposed to the 11 percent initiated by creditors.
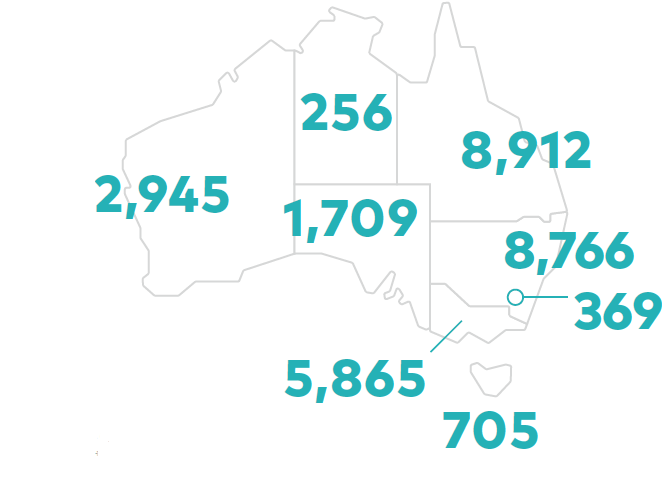
Queensland leads the country for the largest number (8,912) of its residents becoming subject to the Bankruptcy Act 1966. New South Wales follows Queensland as the second largest number of residents: 8,766. In terms of the trend for total personal insolvency activity, it is steadying from the GFC fallout.
Of the 24,928 non-business related bankruptcies, we found the top three causes of those bankruptcies were:
- unemployment or loss of income (43%)
- excessive use of credit (40%)
- domestic discord or relationship breakdown (16%).
Corporate Insolvency
Nationally 45% of company administrations were initiated by its members (directors/shareholders).
24% of the companies that used the voluntary administration regime to get interim relief to assess the potential for a Deed of Company Arrangement were successful.
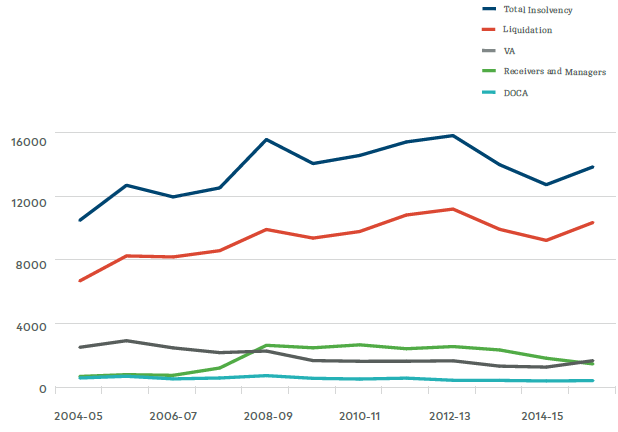
The trend for total corporate insolvency activity shows the peak that followed the GFC was in 2012-13. Contributing factors to the second peak include, a continued lagging effect from the GFC, a stressed construction and property development sector, a stronger Australian dollar, which impacted the tourism and retail industries, and an aggressive ATO debt collection campaign.
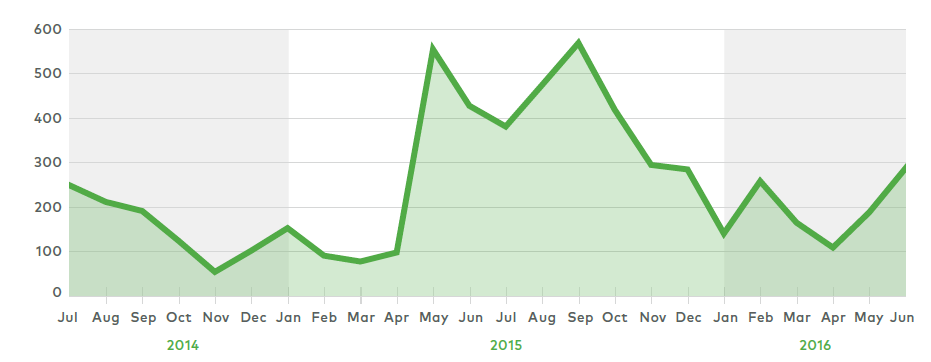
The graph above shows the ATO aggressively pursued its debt recovery over a six-month period (May-Oct 2015). As the ATO’s recovery measures gain momentum—separate from the statistics of winding-up applications—there appear to be just as many, if not more, statutory demands being issued that are due to expire, which will underpin the ATO commencing more winding-up applications in the Federal Court of Australia.

.jpeg?auto=format,compress&cs=tinysrgb&fit=crop&crop=focalpoint&fp-x=0.50&fp-y=0.50&fp-y=0.1&w=800&h=480&q=25&blur=5&sat=-100)

.jpg?auto=format,compress&cs=tinysrgb&fit=crop&crop=focalpoint&fp-x=0.50&fp-y=0.50&fp-y=0.1&w=800&h=480&q=25&blur=5&sat=-100)